Cal Poly Solar Regatta Electrical Lead
Solar Regatta is a Sacramento Municipal Utility District sponsored competition for solar boat racing among California colleges. As electrical lead, I designed and implemented the twin solar panel electrical system. Additionally, I implemented dual-axis solar tracking utilizing an STM Nucleo microcontroller, two linear actuators, and a photoresistor array.

Photoresistor Array
Linear Actuator Design

Analyzing the photoresistor array’s resistances, the actuators align the panels with the point of lowest resistance among all 4 photoresistors.
FPGA RISC-V CPU
Using Xilinx Vivado and SystemVerilog, I implemented a fully functional 32-bit CPU on a Basys 3 AMD Artix 7 FPGA capable of running RISC-V assembly code including arithmetic and PC operations and interacting with peripherals via a wrapper. All of the individual components of the CPU were created from scratch in Vivado and are an immediate generator, process counter, branch address generator/logic, arithmetic logic unit, memory, and supporting components. The CPU functions using an external clock signal which updates the PC unit at regular intervals allowing it to cycle through binary 4 byte instructions held in the memory unit. PC jumps/branches are handled by a conditional unit and immediate generators with any necesarry arithmetic done inside the ALU.

CPU Wrapper

CPU
Animal Presence Classification Utilizing 3 Machine Learning Structures & LoRa Communication on an Edge Device for OWL Integrations
Using OWL Integrations’ open source ClusterDuck Protocol (CDP) for LoRa communication, I designed and implemented three machine learning models responsible for determining if an animal is present in an image then transmitting the result over the LoRa CDP network. Each model was tested in terms of accuracy, precision, recall, and power consumption. Additionally, all three models were compressed and placed on a Raspberry Pi 5, which allowed for mobile autonomous detection and communication in remote areas. I used TensorFlow and Keras to build and train the models with Python scripts, then I used TensorFlow Lite to compress the models and run them on the Raspberry Pi. An SX1262 LoRa shield was responsible for communication and simply transmitted the classification result since LoRa’s low bit rate prevents high-quality data streams wirelessly.
For more information, see full report:

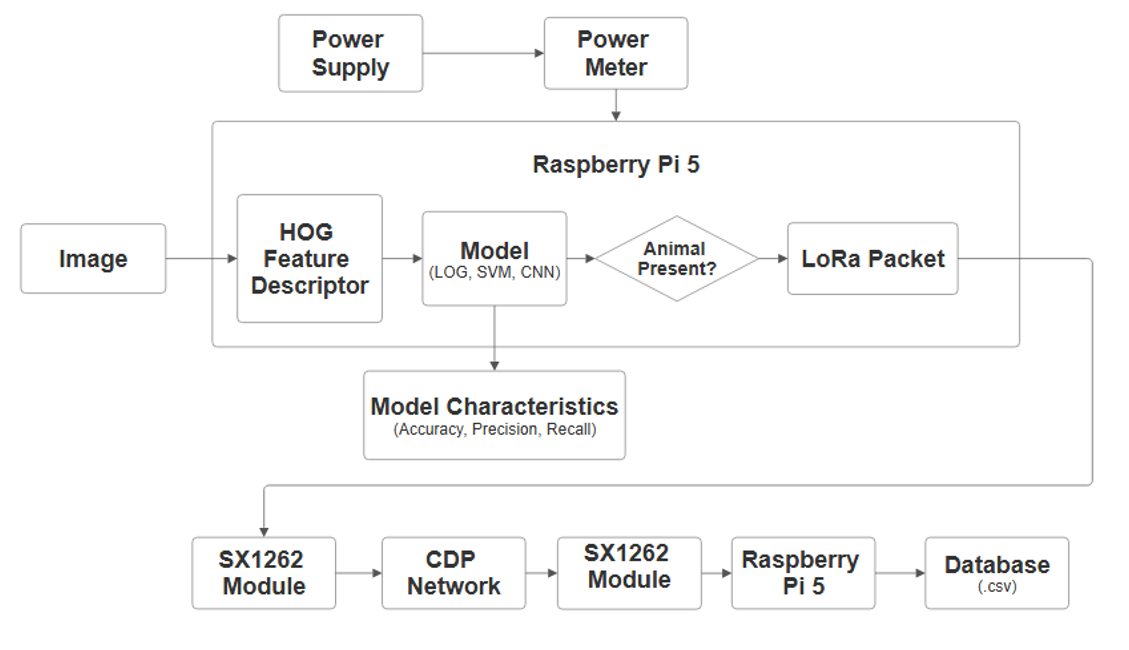
System Flow
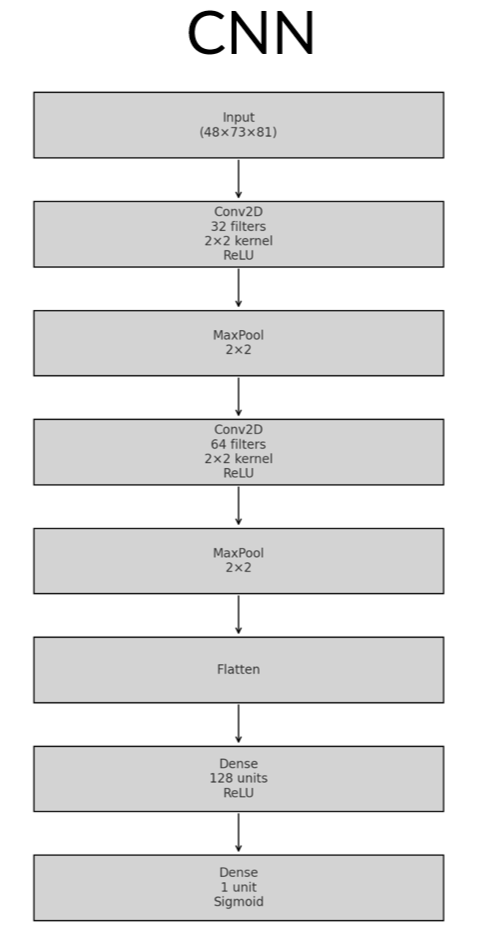
Models

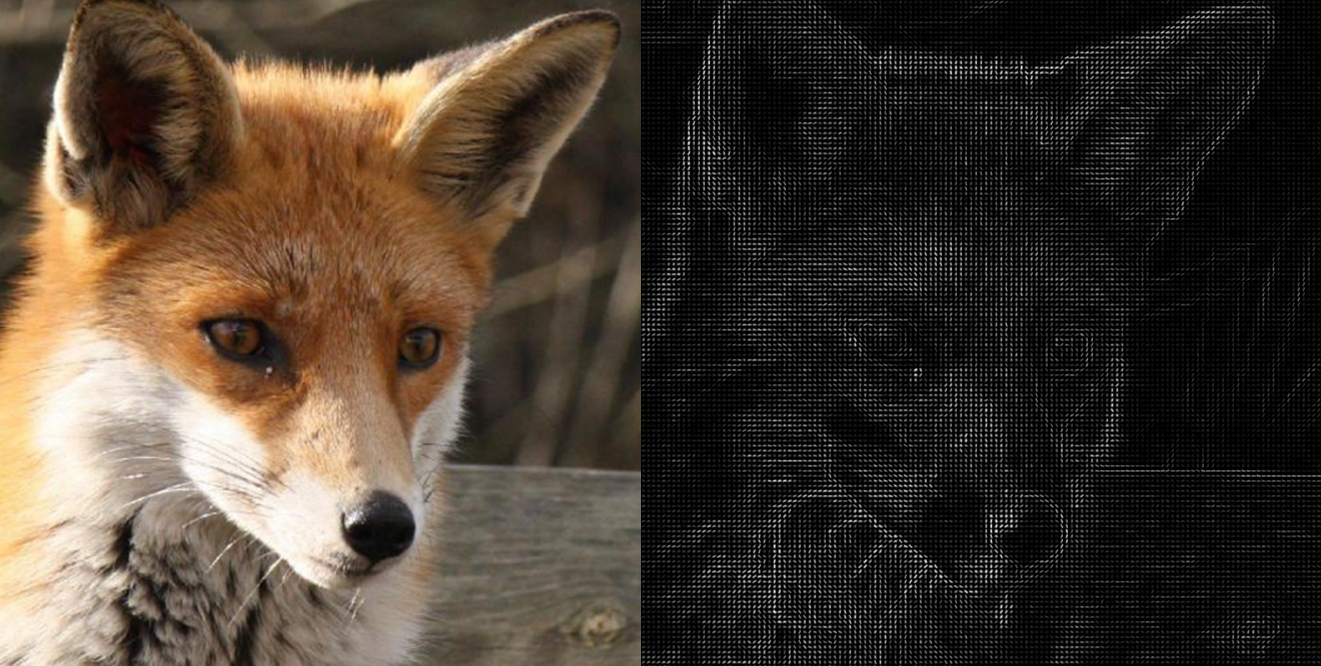
HOG Feature Descriptor
A HOG feature descriptor was generated from each input image to reduce the resolution and allow more efficient model processing. HOG is useful since it reduces the number of input features dramatically, but keeps key shape and orientation data as can be seen below.
Results
*Metrics are specific to dataset


FPGA Battleship FSM
Using Xilinx Vivado, SystemVerilog, and a Basys 3 AMD Artix 7 FPGA, I designed and implemented the game battleship on an FPGA. Running on an FPGA, an FSM cycles between each player giving each a turn and detecting, recording, then visually showing when a battleship is hit. Each player could input locations for each of their 5 ships of varying sizes at the start, then the FSM gave each player a turn until all of one player’s battleships were sunk. Register modules were responsible for saving all necessary data. All modules were built from scratch without using built in Vivado functions.


All decision making is made through multiple MUX modules which take inputs from the registers and FSM modules.
MATLAB FIR Windowed Frequency Sampling Equalizer
Using MATLAB and digital signal processing techniques, I created an equalizer capable of editing sound files by modifying the dB magnitude of 9 frequencies present in the waveform. Using FIR frequency sampling and a fast Fourier transform, a filter is generated from the equalizer’s settings, intermediate samples are interpolated from the equalizer’s settings. The sampling frequency used matches the sampling frequency of the original audio file. Then, the filter is applied to the original waveform. Once the magnitudes are modified by the filter, a Tukey window is used to smooth the waveform. All functions were created from scratch with the exception of FFT.
Viewing the two example frequency responses below, you can see that the equalizer magnitude settings align closely with the frequency response of the waveform. One is a dramatic distortion, while the other is a reasonable equalization.


Temperature Sensor with Ultrasonic Communication via ASK Modulation
I designed and implemented a fully functional temperature sensor system capable of transmitting data up to 3 meters via a 40kHz ultrasonic signal using ICs and an STM NUCLEO microcontroller. Initially, an analog sensor detects the temperature and outputs a corresponding voltage. The NUCLEO reads this signal and converts it to Centigrade with single decimal precision. Each temperature reading, the NUCLEO outputs an ASK modulated 40kHz square wave representing 16 bits directly into the ultrasonic transmitter, which can be seen below (Channel 1: NUCLEO, Channel 2: Ultrasonic TX). The first 4 bits are a constant preamble of 1-0-1-0, with the remaining 12 representing the Centigrade value. Additionally, the entire TX side of the system is battery powered and portable. Unfortunately, there are no pictures of the full breadboarded system.


Once the ultrasonic signal is received, it is put through a 10x inverting amplifier in order for it to reach the minimum voltage required for the following PLL locked onto 40kHz via an experimentally determined timing capacitor and resistor. By driving the input signal to the rails of the op-amp, the sine wave RX signal is converted to a square wave, then the PLL outputs a clean signal as seen below.

Finally, a Raspberry Pi 5 uses the preamble to align its data frame, then samples at regular intervals to receive the 12 temperature bits. To save the data, the Pi uses a TCP server to send the value to a connected computer which can save the readings.
MATLAB Resistor Band Recognition
I created a MATLAB script capable of taking a picture containing multiple resistors, isolating them, correcting orientation, and detecting band colors to determine their values with a high degree of accuracy. First the image is pre-processed with white balancing and bilateral filtering. Next, using the open and close morphological image operations. the background of the image is removed. Now that the resistors are clearly separable, built in MATLAB functions can find connected components and isolate each resistor’s pixels. Finally, using the Minimal Area Rectangle technique, the bounding box for each resistor is found, then rotated so each resistor is aligned horizontally.

Step 1: Image Pre-Processing

Step 2: Morphological Operations

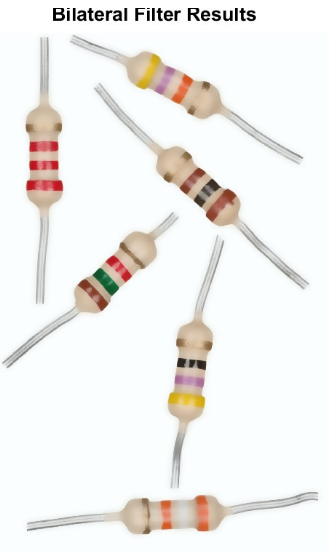
Step 3: Isolated Resistors

Step 4: Orientation Correction

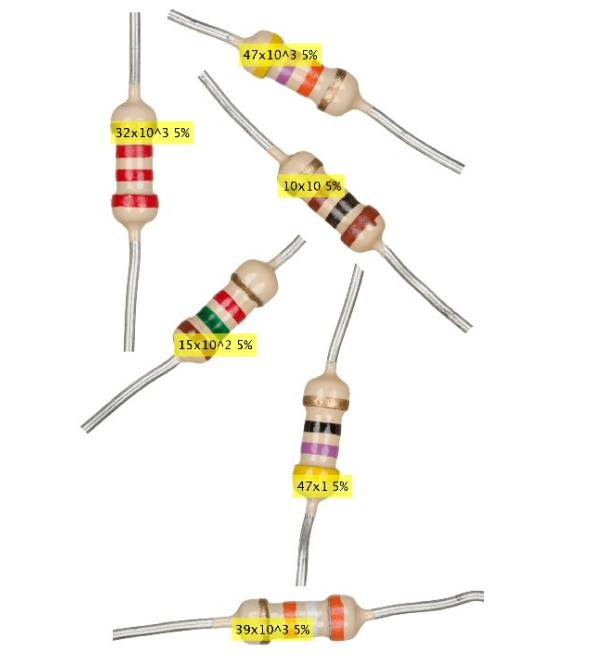
With the isolated, correctly oriented resistors, the next step is to isolate each band of the resistor and determine their colors. First, a vertical edge map is generated from the image using Prewitt edge detection. Looking at the edge map, the areas with a greater concentration of “edge pixels” will represent the start and end of each band. Therefore, the vertical columns with the most edge pixels within certain margins can be found and used to determine the band regions.


With each band isolated, the color of the pixels within the region can be determined. The scope of this script does not include any machine learning, so the color values were determined experimentally since they cannot be learned. The average RGB value of the central column of each band region is calculated and a Euclidean distance function determines the most likely color. Overall, there are issues with bands colored similarly to the body of the resistor, but the majority of resistors can be correctly identified.

EMNIST Character Recognition with a CapsNet Neural Network
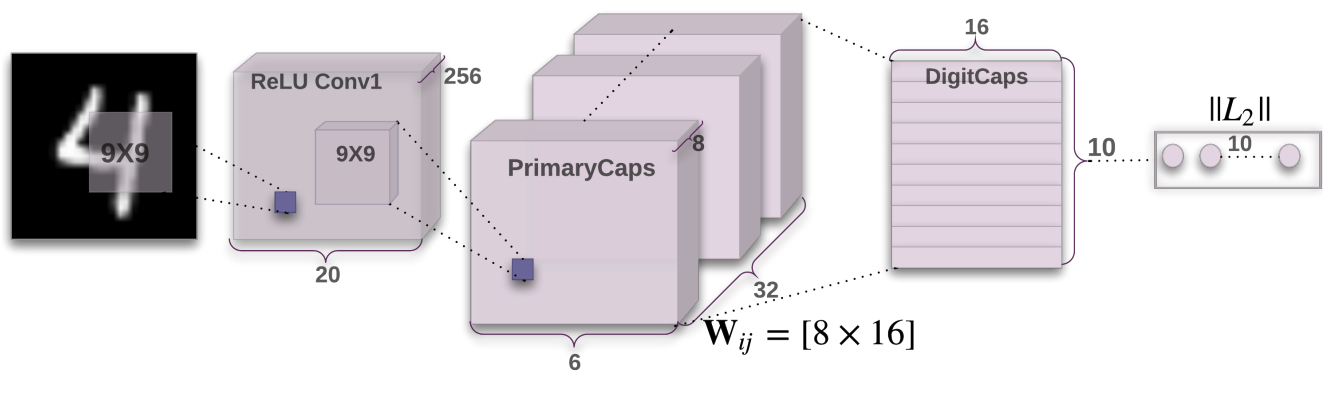
Using a new neural network structure known as Capsule Networks or CapsNets made for the MNIST digits dataset, I built and trained a TensorFlow model with Keras capable of identifying characters in the EMNIST Letters dataset. It functions by grouping neurons into vectors known as “capsules” which can contain a configurable number of neurons. Each capsule represents a characteristic of a letter, for example, the curve of ‘O’ or the tail of ‘Q’. Lower layers represent those smaller features, while higher layers represent larger features culminating in capsules representing the letters themselves. This structure is particularly unique because capsules in each lower layer send their outputs to all capsules in the following layer. However, the upper layer capsules are only activated if the capsules in the preceding layer output a high enough probability of a feature’s presence. This is known as routing by agreement, creating a “voting” system among the capsules. So, continuing with the previous example, if the capsule representing the tail of ‘Q’ outputs a low value, the following ‘Q’ capsule is not activated.
This is rather complicated, but if you would like more details, my full paper can be found here.
EMNIST Letters Dataset

Original MNIST CapsNet Architecture
My EMNIST CapsNet Architecture


Results


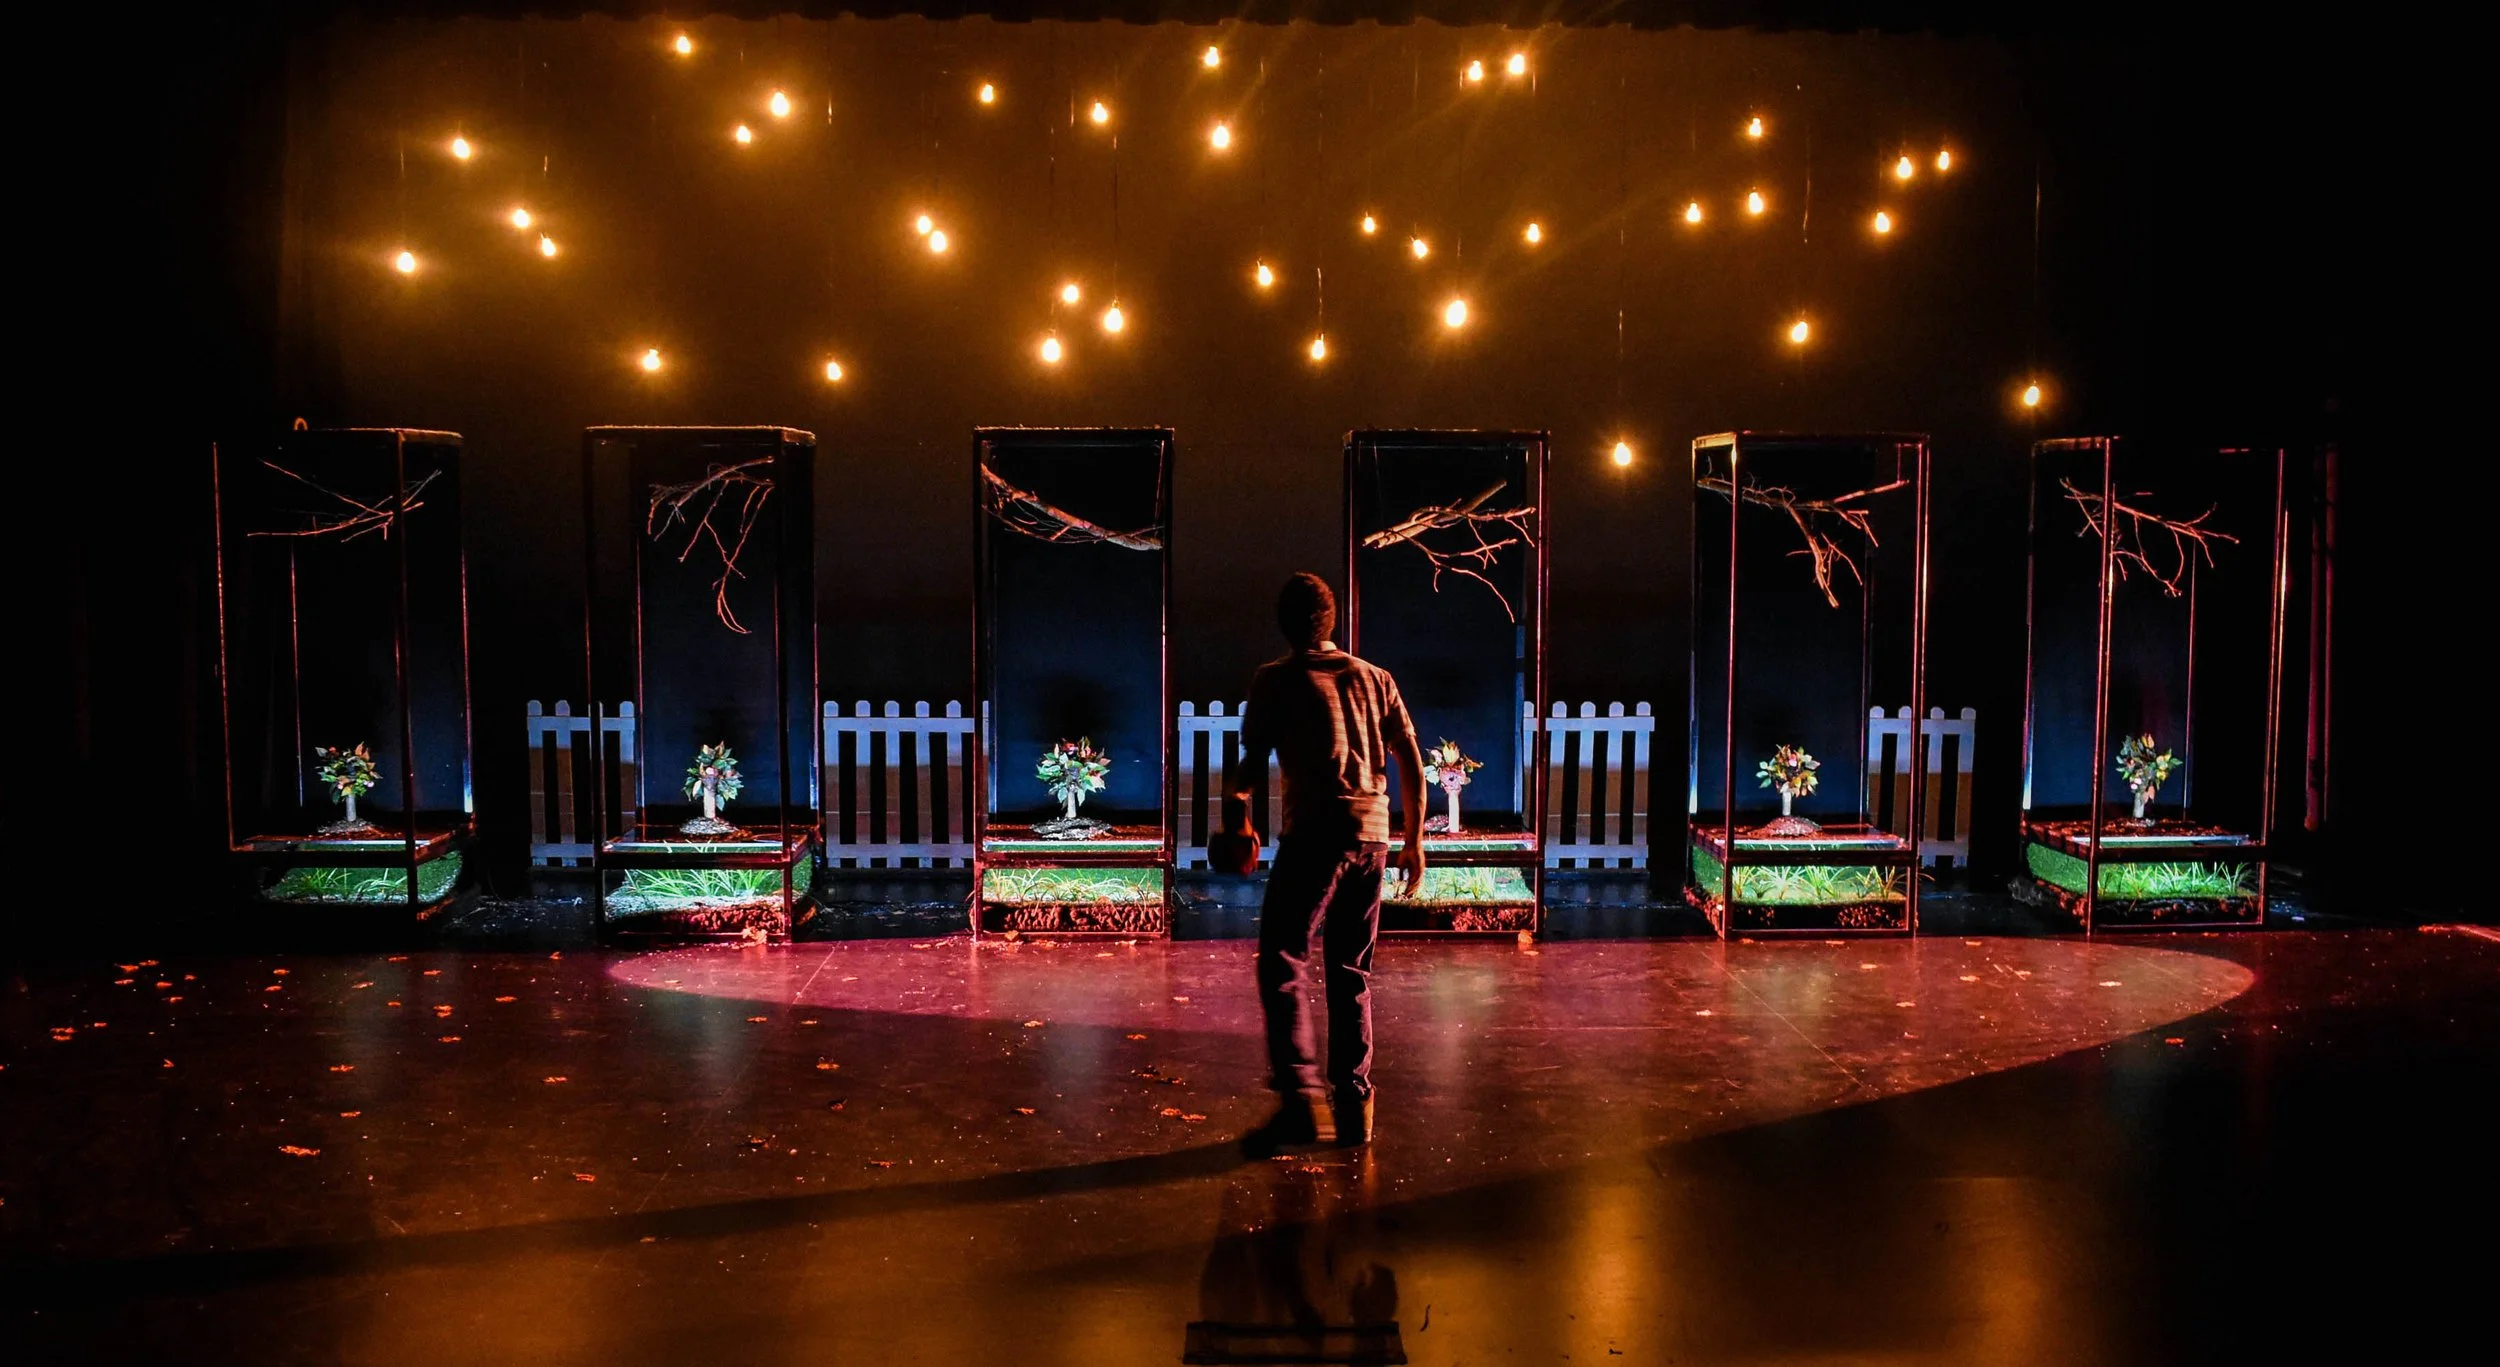
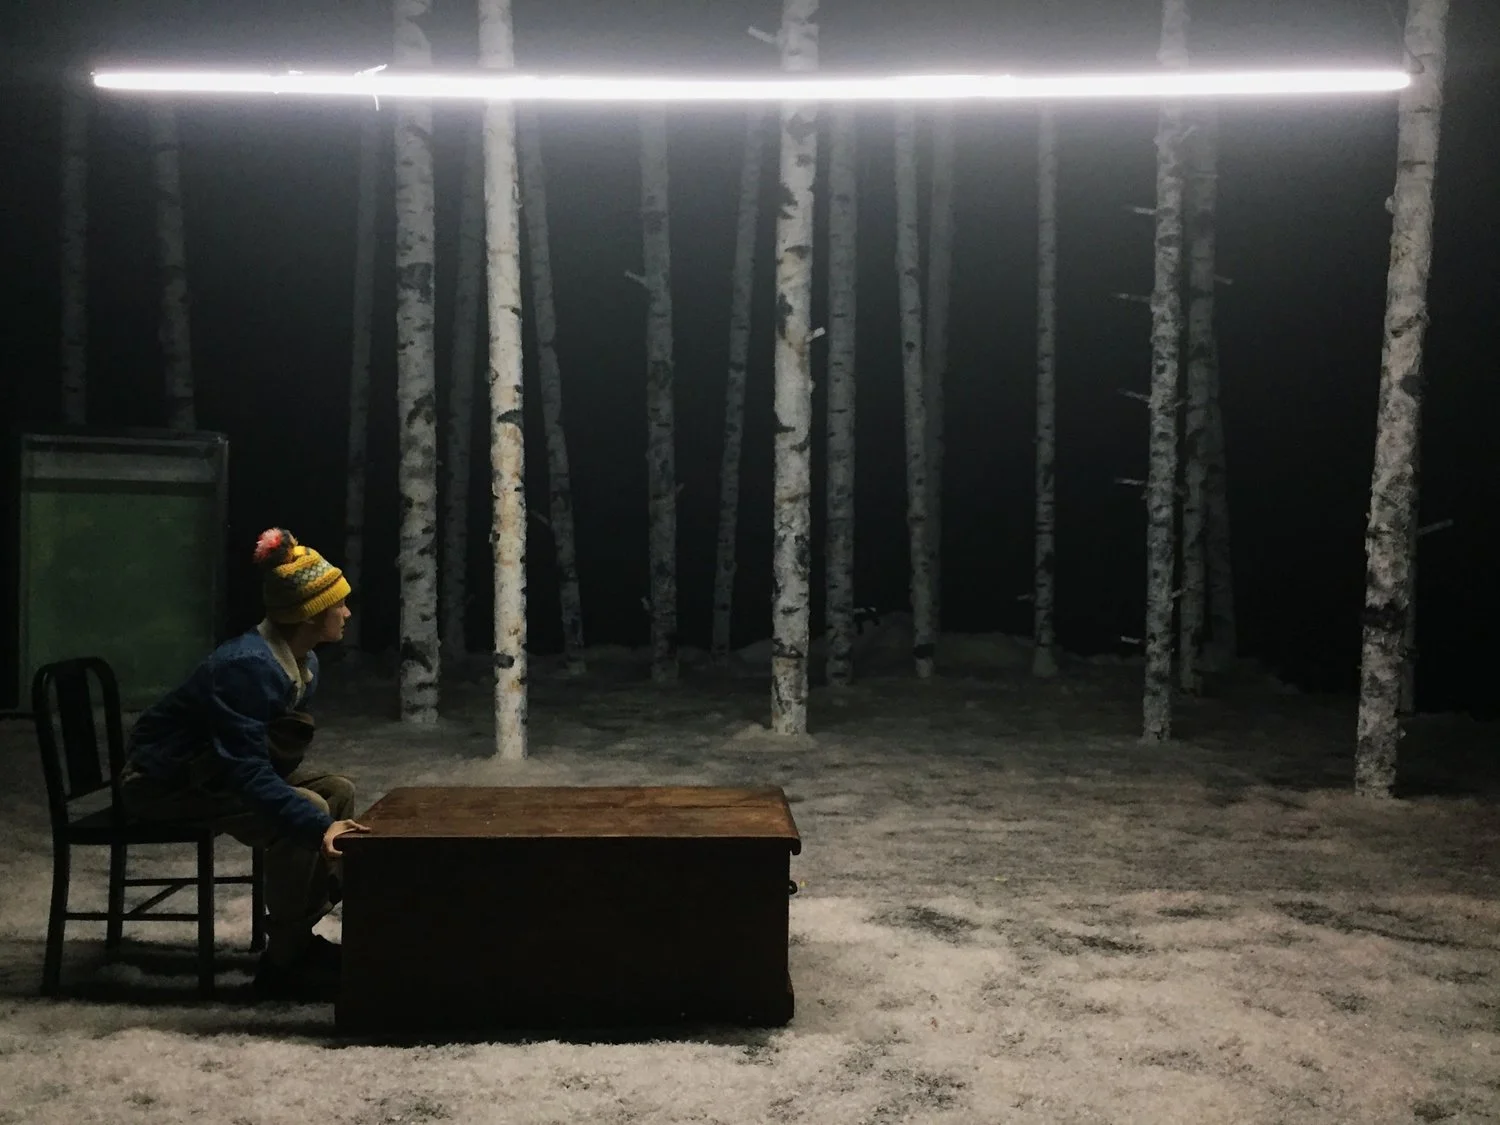
Projections & Lighting for Carnegie Theatre Co.